Ramanjum Filter Banks#
Period estimation using RFB - (spkit version 0.0.9.4)#
Finding the hidden patterns that repeats
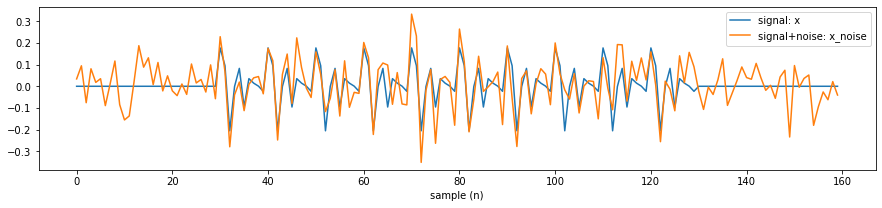
Single pattern with period of 10#
Same example as author has shown
import numpy as np
import matplotlib.pyplot as plt
import scipy.linalg as LA
import spkit as sp
seed = 10
np.random.seed(seed)
period = 10
SNR = 0
x1 = np.zeros(30)
x2 = np.random.randn(period)
x2 = np.tile(x2,10)
x3 = np.zeros(30)
x = np.r_[x1,x2,x3]
x /= LA.norm(x,2)
noise = np.random.randn(len(x))
noise /= LA.norm(noise,2)
noise_power = 10**(-1*SNR/20)
noise *= noise_power
x_noise = x + noise
plt.figure(figsize=(15,3))
plt.plot(x,label='signal: x')
plt.plot(x_noise, label='signal+noise: x_noise')
plt.xlabel('sample (n)')
plt.legend()
plt.show()
Pmax = 40 #Largest period expected in signal
Rcq = 10 #Number of repeats in each Ramanujan filter
Rav = 2 #length of averaging filter
thr = 0.2 #to filter out any value below Thr
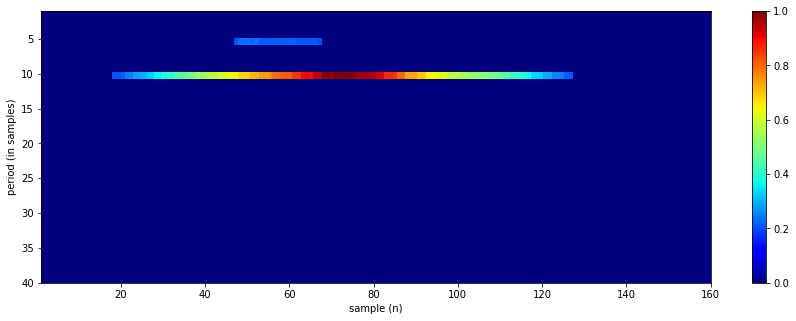
y = sp.RFB(x_noise,Pmax, Rcq, Rav, thr)
plt.figure(figsize=(15,5))
im = plt.imshow(y.T,aspect='auto',cmap='jet',extent=[1,len(x_noise),Pmax,1])
plt.colorbar(im)
plt.xlabel('sample (n)')
plt.ylabel('period (in samples)')
plt.show()
plt.stem(np.arange(1,y.shape[1]+1),np.sum(y,0))
plt.xlabel('period (in samples)')
plt.ylabel('strength')
plt.show()
print('top 10 periods: ',np.argsort(np.sum(y,0))[::-1][:10]+1)
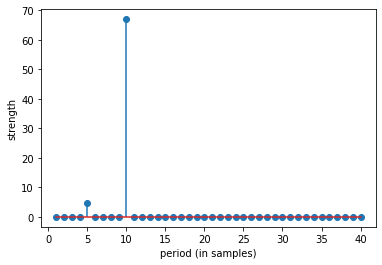
top 10 periods: [10 5 11 18 17 16 15 14 13 12]
Multiple pattern with periods of 3,7 and 10#
Same example as author has shown
import numpy as np
import matplotlib.pyplot as plt
import scipy.linalg as LA
import spkit as sp


np.random.seed(15)
#periods    = [3,7,11]
#signal_length = 100
#SNR = 10
x = np.zeros(signal_length)
for period in periods:
    x_temp  = np.random.randn(period)
    x_temp  = np.tile(x_temp,int(np.ceil(signal_length/period)))
    x_temp  = x_temp[:signal_length]
    x_temp /= LA.norm(x_temp,2)
    x += x_temp

x /= LA.norm(x,2)

noise  = np.random.randn(len(x))
noise /= LA.norm(noise,2)
noise_power = 10**(-1*SNR/20)
noise *= noise_power
x_noise = x + noise

plt.figure(figsize=(15,3))
plt.plot(x,label='signal: x')
plt.plot(x_noise, label='signal+noise: x_noise')
plt.xlabel('sample (n)')
plt.legend()
plt.show()


Pmax = 90

periodE = sp.PeriodStrength(x_noise,Pmax=Pmax,method='Ramanujan',lambd=1, L=1, cvxsol=True)

plt.stem(np.arange(len(periodE))+1,periodE)
plt.xlabel('period (in samples)')
plt.ylabel('strength')
plt.title('L1 + penality')
plt.show()

print('top 10 periods: ',np.argsort(periodE)[::-1][:10]+1)


periodE = sp.PeriodStrength(x_noise,Pmax=Pmax,method='Ramanujan',lambd=0, L=1, cvxsol=True)

plt.stem(np.arange(len(periodE))+1,periodE)
plt.xlabel('period (in samples)')
plt.ylabel('strength')
plt.title('L1 without penality')
plt.show()


print('top 10 periods: ',np.argsort(periodE)[::-1][:10]+1)


periodE = sp.PeriodStrength(x_noise,Pmax=Pmax,method='Ramanujan',lambd=1, L=2, cvxsol=False)

plt.stem(np.arange(len(periodE))+1,periodE)
plt.xlabel('period (in samples)')
plt.ylabel('strength')
plt.title('L2 +  penalty')
plt.show()

print('top 10 periods: ',np.argsort(periodE)[::-1][:10]+1)


y = sp.RFB(x_noise,Pmax = Pmax, Rcq=10, Rav=2, Th=0.2)

plt.figure(figsize=(15,5))
im = plt.imshow(y.T,aspect='auto',cmap='jet',extent=[1,len(x_noise),Pmax,1])
plt.colorbar(im)
plt.xlabel('sample (n)')
plt.ylabel('period (in samples)')
plt.show()

plt.stem(np.arange(1,y.shape[1]+1),np.sum(y,0))
plt.xlabel('period (in samples)')
plt.ylabel('strength')
plt.show()

print('top 10 periods: ',np.argsort(np.sum(y,0))[::-1][:10]+1)


XF = np.abs(np.fft.fft(x_noise))[:1+len(x_noise)//2]
fq = np.arange(len(XF))/(len(XF)-1)

plt.stem(fq,XF)
plt.title('DFT')
plt.ylabel('| X |')
plt.xlabel(r'frequency $\times$ ($\omega$/2)   ~   1/period ')
plt.show()